How to Track Content Marketing ROI
Content Marketing ROI: is a percentage that shows how much revenue you gained from content marketing in comparison to what you spent. ROI is said to be one of the most important measures of successful content marketing because it's directly tied to revenue.
Topics Covered in This Article
How to Track Content Marketing ROI
This article is your start-to-finish guide on How to Track Content Marketing ROI. This topic is connected to the eighth step of your Content Marketing Strategy, which is what we call your Cost-Benefit Analysis.
This article uses terminology and references ideas discussed in our other articles. So, I suggest you read our articles on Buyer’s Persona vs Customer Journey, How to Create a Content Distribution Strategy, and How to Track Content Marketing Goals and KPIs.
Knowing How to Track Content Marketing ROI will help you quickly discover what’s working, and what isn’t. This way, you can do more of what’s working, and less of what’s not. Tracking your Content Marketing ROI also helps you analyze and troubleshoot the weak links in your content marketing funnel.
Most importantly, knowing How to Track Content Marketing ROI helps you increase your profit, decrease your cost per customer acquisition, and maximize every dollar you invest into your content marketing strategy. Most importantly, it will help you build and optimize something I call your “ROI Strategy.”
Anatomy of an ROI Strategy
ROI Strategy: a multi-stage, multi-channel marketing system that uses automated technology to consistently distribute timely and relevant promotional messages to your Buyer Persona(s) using only the most valuable, relevant, and credible distribution channels. An ROI Strategy guides your prospect through five stages 1) Connection, 2) Collection, 3) Continuity, 4) Conversion, and 5) Consumption.
There’s a popular saying that goes, “Marketing is not an exact science.” This is based on a false conception of marketing. Marketing can be just as scientific as any of the soft sciences. A “soft science” is a discipline that interprets human behavior, institutions, and society on using scientific investigations for which it may be difficult to establish strict measurable criteria.
Some examples of soft sciences include psychology, sociology, anthropology, political science, etc). While marketing isn’t on this list (yet), this article shows you how marketing can become an even more objective and reliable discipline than any of these soft sciences. It starts with understanding the two ingredients of scientific marketing, the first of which is math, and the second of which is psychology.
I teach the psychology of content marketing in my 10 Persuasive Copywriting Techniques series, in our article on How to Create a Buyer Persona, and our Buyer’s Journey vs Customer Journey article. The mathematical ingredient starts with understanding the Anatomy of an ROI Strategy and the hard science behind it. An ROI Strategy is a fully or partially automated system that takes your prospect through five marketing stages:
– Article Continues Below Infographic –
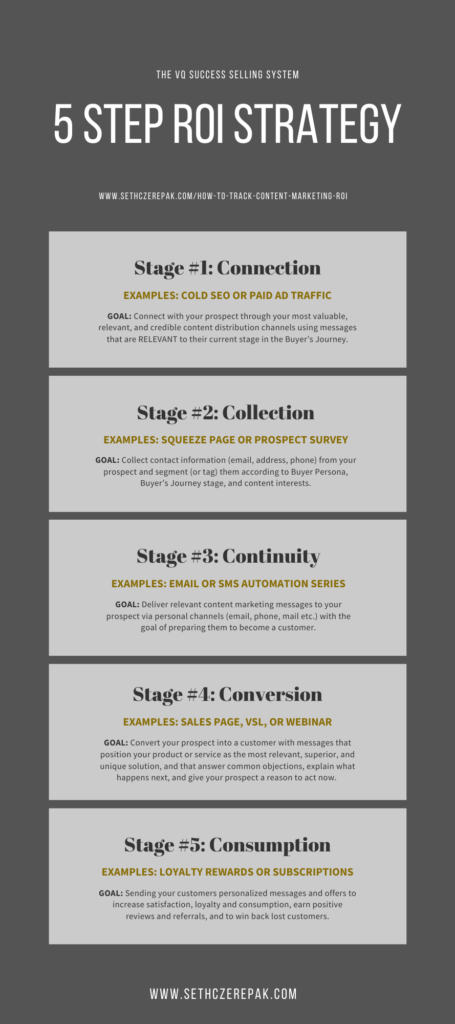
These five stages are not to be confused with the five stages of the Buyer’s Journey. The difference is that the Buyer’s Journey Stages are based on your prospect’s state of awareness while the ROI Strategy stages are based on your interactions with them.
For example, your first Connection with a prospect might happen when they’re in Stage #1, Stage #2, or Stage #3 of the Buyer’s Journey. Likewise, you might Collect your prospect’s contact information while they’re in Stage #1, Stage #2, or Stage #3 of the Buyer’s Journey. However, this does not guarantee that your prospect has progressed to the next stage of the Buyer’s Journey.
Your subscriber list can contain prospects who are at any stage of the Buyer’s Journey. This is why it’s important to tag and segment your leads and serve them content marketing messages relevant to their stage in the Buyer’s Journey. This is the Continuity stage of your ROI Strategy.
Again, the Buyer’s Journey Stages are based on your prospect’s state of awareness while the ROI Strategy stages are based on your interactions with them. If you’re still unclear about this idea, don’t worry. I’ll explain the difference in more detail as we unpack the five stages of your ROI Strategy.
ROI Strategy Stage #1: Connection
GOAL: Connect with your prospect through your most valuable, relevant, and credible content distribution channels using messages that are RELEVANT to their current stage in the Buyer’s Journey.
Examples of Connection Content
How to Track Content Marketing ROI for Stage #1
How valuable is your website traffic? If your PPC ad gets 5,000 views, how much are those views worth? If one of your social media posts reaches 1,000 people, how many leads, on average, should you expect and how many of them are likely to become customers?
If you don’t know the answers to these questions not marketing, you’re gambling. Everything you do in marketing should produce a measurable result, whether positive or negative. Moreover, you should be able to connect this result to a gain or loss in revenue.

If this sounds unrealistic, I encourage you to apply the two ingredients of scientific marketing (math and psychology) as explained below and see for yourself. Starting with the math, this table defines the Content Marketing KPIs relevant to the Connection stage of your ROI Strategy, including the formula for each KPI and an example of the formula:
NOTE: The “SEO Article #9” in the examples below is a fictitious name for a single page of content.
Lead Collection Rate
Lead Collection Rate (LCR)
The percentage of your content views (impressions) that become leads
Lead Collection Rate Example
*This number represents the total number of leads who first connected with your content by visiting “SEO Article #9.” In this example, 120 of the 3,000 people who first found your content through “SEO Article #9” eventually submitted their contact information and became leads.
**You are reading the VQ Success article on How to Track Content Marketing ROI.
Lead Collection Cycle
Lead Collection Cycle (LCC)
The average number of days between a prospect’s first content view (impression) and lead collection time
Lead Collection Cycle Example
*This number represents the total number of leads who first connected with your content by visiting “SEO Article #9.” In this example, 120 of the 3,000 people who first found your content through “SEO Article #9” eventually submitted their contact information and became leads.
**You are reading the VQ Success article on How to Track Content Marketing ROI.
Cost Per Lead
Cost Per Lead (CPL)
How much it costs you to collect a prospect’s contact information
*The “item” can be a campaign, a distribution channel, or an individual piece of content.
Cost Per Lead Example
*This number represents the total number of leads who first connected with your content by visiting the “SEO Article #9:” In this example, 120 of the 3,000 people who first found your content through the “SEO Article #9” eventually submitted their contact information and became leads.
*You are reading the VQ Success article on How to Track Content Marketing ROI.
Lead to Conversion
Lead to Conversion Rate (L2C)
The percentage of collected leads who eventually become paying customers
Lead to Conversion Rate Example
*This number represents the total number of leads who first connected with your content by visiting “SEO Article #9.” In this example, 120 of the 3,000 people who first found your content through “SEO Article #9” eventually submitted their contact information and became leads.
*You are reading the VQ Success article on How to Track Content Marketing ROI.
ROI Stage #1 Forecast Formulas
(The examples below are based on the KPI examples in the table above)
Lead Collection Forecast*
*This forecast uses your 4% Lead Collection Rate to estimate how many leads might result from 10,000 visits to “SEO Article #9.”
Sales Conversion Forecast
ROI Stage #1 and Marketing Psychology
Your success with the forecasting strategies above will depend on how well you apply the second ingredient of scientific marketing, which is psychology. The foundation of content marketing psychology (Angle Selling) is the Buyer’s Journey.
Remember that the ROI Strategy Stages are based on your interactions with a prospect while the Buyer’s Journey Stages are based on that prospect’s state of awareness. For example, the Connection stage of your ROI Strategy is when your prospect discovers the first content marketing message published by your organization. It represents your first interaction with your prospect.
Regardless of their Buyer’s Journey stage, your ROI Strategy focus is to collect your prospect’s contact information (email, phone, mailing address), thus moving them to the Continuity stage of your ROI Strategy. Your Buyer’s Journey focus, however, will depend on which stage of the Buyer’s Journey your prospect is in when you first connect with them.
Here’s the golden nugget, your success in getting a prospect to the next stage of your ROI Strategy will depend on how relevant your message is to their stage in the Buyer’s Journey.
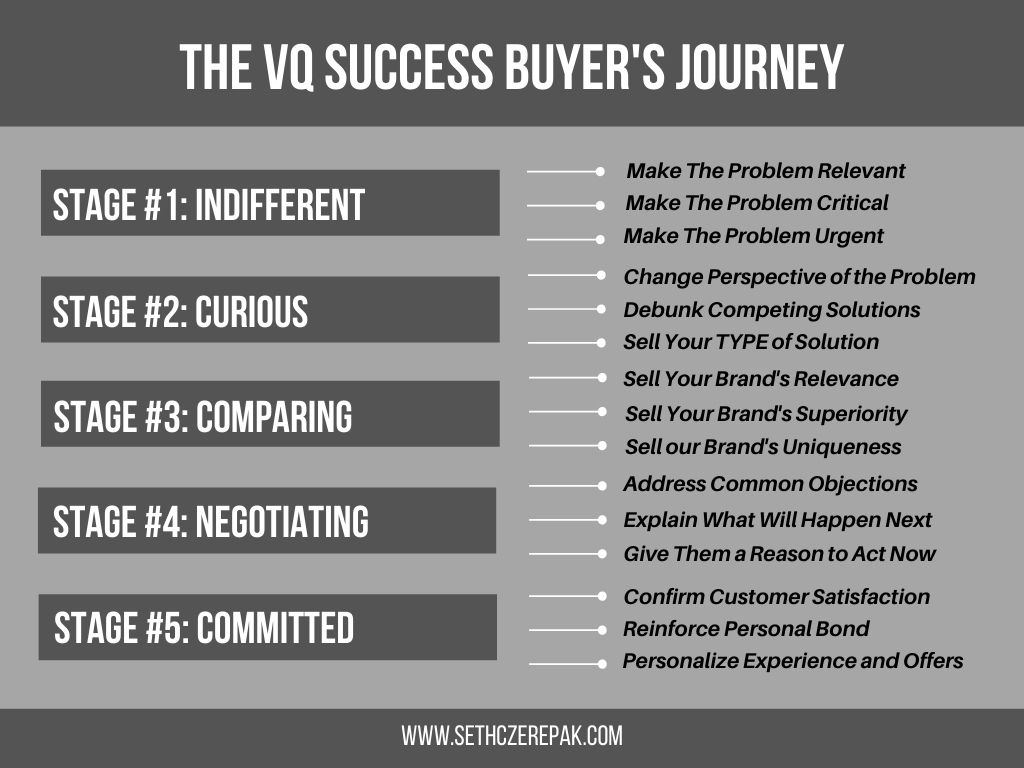
READ MORE: Buyer’s Journey vs Customer Journey article.
Your first connection with a prospect might be while they are Stage #1, Stage #2, or Stage #3 of the Buyer’s Journey. Whenever possible, you want to make sure your messaging strategy and lead collection offer are relevant to their stage in the Buyer’s Journey.
For example, let’s assume you write an article with a headline, opening, and core message that’s customized to prospects in Stage #1 of the Buyer’s Journey. The goal of this article would be to raise their awareness and turn them into a Stage #2 Prospect. The article would also include an invitation to download a file, click to another web page, or submit their contact information in exchange for more information.
You then create a PPC ad or a social media teaser to promote this article. Now you know that if a visitor clicks on this ad, they are most likely a Stage #1 Prospect. Your website should have the automation capability (If your website is built on WordPress, we recommend the Vervenia User Segmenting Plugin for WordPress) to segment or tag the visitor as a Stage #1 Prospect and to mark that article page as their first point of connection with your company.
If they accept your invitation to download a file, click to another web page, or submit their contact information in exchange for more information, your website should update them to a Stage #2 Prospect. This way, when the prospect returns to your website, or when you send them an email or SMS message, you can program your marketing automation software to send messages relevant to Stage #2 of the Buyer’s Journey.
Most importantly, if this prospect ends up becoming a paying customer, you’ll be able to attach this customer, and all their purchases, to the original article and social media ad through which you first connected with them. This is an example of how you’d use automation technology and Buyer’s Journey Psychology to get crystal clear insight into where all your traffic, leads, customers, and purchases are coming from.
– Article Continues Below Stats –
Connection Stats: Relevance Trumps Visibility
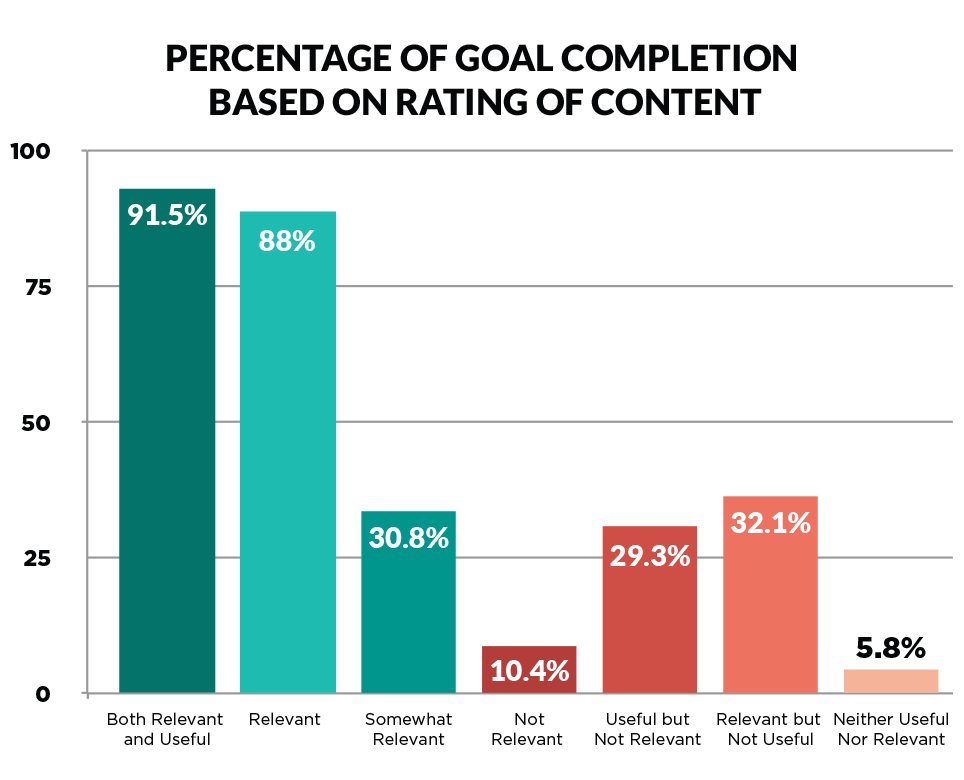
SOURCE: Content Science Study on Content Relevance & Usefulness
– Article Continues Below Comic –
*You are reading the VQ Success article on How to Track Content Marketing ROI
ROI Strategy Stage #2: Collection
GOAL: Collect contact information (email, address, phone) from your prospect and segment (or tag) them according to Buyer Persona, Buyer’s Journey stage, and content interests.
Examples of Collection Content
How to Track Content Marketing ROI for Stage #2
How much is a lead worth to you? It depends on the lead, doesn’t it? More importantly, it depends on your relationship with the lead. There’s a saying among marketers that goes, “The money is in the list.”
If this were true, we wouldn’t need to spend time and money on marketing. We could just go to a list broker, buy tens of thousands of leads, and get rich. But the truth is, 100 leads can be more valuable than 100,000 leads. It all depends on a few important factors.

First, it depends on whether they represent your target market. Secondly, it depends on whether they see you as a Thought Leader who deserves their attention and their business. Most importantly, it depends on how well you apply the two ingredients of scientific marketing mentioned earlier in this article (math and psychology).
Starting with the math, the table below defines the Content Marketing KPIs relevant to the Collection stage of your ROI Strategy, including the formula for each KPI and an example of the formula:
NOTE: The “SEO Article #9” in the examples below is a fictitious name for a single page of content.
Conversion Rate
Lead to Conversion Rate (L2C)
The percentage of collected leads who eventually become paying customers
Lead to Conversion Rate Example
*This number represents the total number of leads who first connected with your content by visiting “SEO Article #9.” In this example, 120 of the 3,000 people who first found your content through “SEO Article #9” eventually submitted their contact information and became leads.
*You are reading the VQ Success article on How to Track Content Marketing ROI.
Conversion Cycle
Conversion Cycle (CC)
The average number of days between lead collection time and the first purchase (conversion)
Conversion Cycle Example
*This number represents the total number of converted leads who first connected with your content by visiting “SEO Article #9.” In this example, 24 of prospects who first found your content through “SEO Article #9” submitted their contact information at some point after, and eventually became paying customers.
**You are reading the VQ Success article on How to Track Content Marketing ROI.
Cost Per Conversion
Cost Per Conversion (CPC)
How much it costs you to collect a lead and convert them into a customer
*The “item” can be a campaign, a distribution channel, or an individual piece of content.
Cost Per Conversion Example
*This number represents the total number of converted leads who first connected with your organization’s content by visiting “SEO Article #9.” In this example, 24 of prospects who first found your content through “SEO Article #9” submitted their contact information at some point after, and eventually became paying customers.
*You are reading the VQ Success article on How to Track Content Marketing ROI.
Conversion Value
Conversion Value (CV)
The average amount of income earned from a new customer conversion
Conversion Value Example
*This number represents the total number of converted leads who first connected with your organization’s content by visiting “SEO Article #9.” In this example, 24 of prospects who first found your content through “SEO Article #9” submitted their contact information at some point after, and eventually became paying customers.
**You are reading the VQ Success article on How to Track Content Marketing ROI.
ROI Stage #2 Forecast Formulas
(The examples below are based on the KPI examples in the table above)
Lead Conversion Forecast*
*The 400 leads in this example are based on the Stage #1 Forecast Formulas from the previous section of this article.
Conversion Income Forecast
ROI Stage #2 and Marketing Psychology
The forecasting formulas above and the previous section suggest that 10,000 visits to “SEO Article #9” will yield (on average) 400 leads, and that those 400 leads will likely yield 80 new customers, and that those 80 customers will yield an average of $40,000 in total income.
This tells you that, on average, new a visit to your “SEO Article #9” is worth about $4. But that’s not all. The combination of your Lead Collection Cycle KPI (6.1 days on average) and your Conversion Cycle KPI (47 days on average) tells you that it will take approximately 53.1 days for a brand new visitor to “SEO Article #9” to become a paying customer.
Considering all these factors, how confident would you be to invest $10,000 a month to drive 10,000 new (and qualified) visitors to “SEO Article #9?” The math tells you that it would take a little less than two months (53.1 days) to start seeing a return on your investment. It also suggests that by the third month, you’ll have invested about $30,000 to make an estimated $40,000 to $60,000.
Most importantly, it tells you that you’ll have about 240 new customers, which, as you’ll see later in this article, is where the real ROI is made. I’ve personally seen this kind of math turn several entrepreneurs into millionaires. The problem is, that most marketers either don’t track KPIs at all or don’t know how to forecast ROI. More importantly, they either don’t know or don’t apply the second ingredient of scientific marketing, which is psychology.
As mentioned before, The foundation of content marketing psychology (Angle Selling) is the Buyer’s Journey. Regardless of their Buyer’s Journey stage, your goal at this stage is to collect your prospect’s contact information (email, phone, mailing address), thus moving them to the Continuity Stage of your ROI Strategy.
However, you also want any emails, SMS, push notifications, direct mails, and other follow-up messages you send to be relevant to their Buyer Persona, their Buyer’s Journey Stage, and their content interests.

READ MORE: Buyer’s Journey vs Customer Journey article.
For example, let’s assume you publish a video on your website with a title, opening, and core message targeting prospects in Stage #2 of the Buyer’s Journey. The goal of this video is to raise your prospect’s awareness and turn them into a Stage #3 Prospect. The video page will also include an invitation to download a PDF, watch another video, or fill out a short survey in exchange for more information about your product, service, or company.
You create a PPC ad, social media post, or a teaser video (posted on a video sharing site) to promote this video. Now you know that if a visitor lands on this video page of your website, they are most likely a Stage #2 Prospect. Your website should have the automation capability (If your website is built on WordPress, we recommend the Vervenia User Segmenting Plugin for WordPress) to segment or tag the visitor as Stage #2 Prospect and to mark that video page as their first point of connection with your company.
If they accept your invitation to download the PDF, watch the second video, or fill out the survey, your marketing automation technology should update them to a Stage #2 Prospect. This way, when the prospect returns to your website, or when you send them an email, SMS message or other private communication, you can send messages relevant to Stage #3 of the Buyer’s Journey.
However, if they don’t watch the full video, you know that they’re still a Stage #2 Prospect. Either way, you can now customize any future messages based on how you’ve tagged or segmented your prospect. Most importantly, if your prospect converts into a customer, you can use the KPI strategies later in this article to determine how much ROI that very first Stage #2 video page (and the PPC ad, social media post, or teaser video) is helping you bring in.
This is an example of how to use automation technology and Buyer’s Journey Psychology to customize and personalize your content marketing messages. Combine this with the ROI Forecasting strategies in this article, and you’ve got the full power of scientific marketing working for you.
– Article Continues Below Stats –
Collection Stats: Inbound Leads = More ROI
– Article Continues Below Comic –
*You are reading the VQ Success article on How to Track Content Marketing ROI
ROI Strategy Stage #3: Continuity
GOAL: Deliver relevant content marketing messages to your prospect via personal channels (email, phone, mail etc.) with the goal of preparing them to become a customer.
Examples of Continuity Content
How to Track Content Marketing ROI for Stage #3
Your success as a content marketer will rise and fall on your ability to build and monetize your lead list. Inbound lead generation is one of the most commonly cited benefits of a content marketing strategy.
A 2017 CMI Report stat tells us that content marketing generates three times as many leads as outbound marketing and is 62% less expensive. Inbound leads are also more likely to convert into paying customers and to spend more money when they do.

However, your success with converting inbound leads into loyal customers depends on how well you apply the two ingredients of scientific marketing mentioned earlier in this article (math and psychology). Starting with the math, the table below defines the Content Marketing KPIs relevant to the Continuity stage of your ROI Strategy, including the formula for each KPI and an example of the formula:
NOTE: The “SEO Article #9” in the examples below is a fictitious name for a single page of content.
Segment Lead Collection Rate
Segment Lead Collection Rate (LCR)
The percentage of your content views (impressions) that become leads and were added to a certain segment
Segment Lead Collection Rate Example
*This number represents the total number of leads who first connected with your content by visiting “SEO Article #9” and who were added to a specific segment. In this example, 60 of the 3,000 people who first found your content through “SEO Article #9” eventually submitted their contact information and were assigned to a segment of your lead list.
*You are reading the VQ Success article on How to Track Content Marketing ROI.
Segment Lead Conversion Rate
Segment Conversion Rate (L2C)
The percentage of leads in a segment who eventually become paying customers
Segment Conversion Rate Example
*This number represents the total number of leads who first connected with your content by visiting “SEO Article #9” and who were added to a specific segment. In this example, 60 of the 3,000 people who first found your content through “SEO Article #9” eventually submitted their contact information and were assigned to a segment of your lead list.
*You are reading the VQ Success article on How to Track Content Marketing ROI.
Segment Conversion Cycle
Segment Conversion Cycle (CC)
The average number of days between lead collection time and the first purchase for leads in a certain segment
Segment Conversion Cycle Example
*This number represents the total number of converted leads who first connected with your content by visiting “SEO Article #9” and who were added to a specific segment. In this example, 18 of leads who first found your content through “SEO Article #9” were assigned to a segment of your lead list, and eventually became paying customers.
**You are reading the VQ Success article on How to Track Content Marketing ROI.
Segment Conversion Value
Segment Conversion Value (CV)
The average amount of income earned from a new customer conversion for leads in a certain segment
Segment Conversion Value Example
*This number represents the total number of converted leads who first connected with your content by visiting “SEO Article #9” and who were added to a specific segment. In this example, 18 of leads who first found your content through “SEO Article #9” were assigned to a segment of your lead list, and eventually became paying customers.
**You are reading the VQ Success article on How to Track Content Marketing ROI.
ROI Stage #3 Forecast Formulas
(The examples below are based on the KPI examples in the table above)
Segment Lead Collection Forecast*
*This forecast uses your 2% Segment Lead Collection Rate to estimate how many leads might result from 10,000 visits to “SEO Article #9.”
Segment Conversion Forecast
Segment Income Forecast
ROI Stage #3 and Marketing Psychology
The forecasting formulas above suggest that 10,000 visits to “SEO Article #9” will yield (on average) 200 leads for a certain segment. For this example, let’s assume that the segment is called “Buyer Persona #3,” and that it represents one of your Buyer Personas. The above KPI forecast tells you that 200 of your “Buyer Persona #3” leads will likely yield 60 new customers and $36,000 in total income.
This tells you that, on average, a new visit to your “SEO Article #9” from a “Buyer Persona #3” prospect is worth about $3.60. But that’s not all. Your Lead Collection Cycle KPI (6.1 days on average) and your Segment Conversion Cycle KPI (43 days on average) tell you that it will take about 49.1 days for a new “Buyer Persona #3” visitor to “SEO Article #9” to become a customer.
This means that if you invest $10,000 to drive 10,000 new “Buyer Persona #3” visitors to “SEO Article #9,” you would likely attract 600 new “Buyer Persona #3” leads within 90 days. Within five months, about 180 of those leads will become new customers, bringing in approximately $108,000. Of course, these numbers depend on how well you apply the second ingredient of scientific marketing, which is psychology.
Assuming you’ve applied Buyer’s Psychology to the first two stages of your ROI Strategy, the secret to ROI Stage #3 is content personalization. Personalization is the #1 reason to segment and tag your web visitors, leads, and customers according to their Buyer Persona, Buyer’s Journey Stage, and content interests.
Personalized emails deliver 600% higher transaction rates and 65% of marketers say dynamic content is their most effective personalization tactic. Personalized emails also have 29% higher open rates and 41% higher click rates.

READ MORE: Buyer’s Journey vs Customer Journey article.
Segmented personalized emails average 46% higher open rates and personalized email marketing generates a median ROI of 122%. They also tell us that segmented, targeted, and personalized emails generate 58% of all revenue. Personalization is also important for website content and for your lead collection and sales conversion offers.
Content personalization stats tell us that 91% of consumers are more likely to shop with brands that provide offers specific and relevant to them. Moreover, 80% of frequent shoppers (self-classified) only shop with brands that personalize their experience. 80% of customers are more likely to purchase products or services from brands that provide personalized experiences.
79% of consumers are only likely to respond to brand offers personalized to reflect their previous interactions with the brand. On the other hand, 71% of consumers, on average, feel frustrated when a shopping experience is impersonal and 47% of consumers check Amazon if a specific brand doesn’t provide relevant product suggestions.
(READ MORE: Vervenia Email and Content Personalization Statistics)
Bottom line, if you segment and tag your visitors and leads using the strategies discussed earlier in this article, you can personalize your content marketing messages and create more predictable marketing results. This is when the math of scientific marketing becomes practical and powerful.
– Article Continues Below Stats –
Continuity Stats: Lead Nurturing = More ROI
– Article Continues Below Comic –
*You are reading the VQ Success article on How to Track Content Marketing ROI
ROI Strategy Stage #4: Conversion
GOAL: Convert your prospect into a customer with messages that position your product or service as the most relevant, superior, and unique solution, and that answer common objections, explain what happens next, and give your prospect a reason to act now.
Examples of Conversion Content
How to Track Content Marketing ROI for Stage #4
There are two reasons to make a sale. The first is to earn income. The second is to gain a customer. The second is much more valuable, and should be the priority for every serious content marketer.
Rubber Chicken Marketers focus all their attention on earning income and increasing conversion rates. If your goal in making new sales is simply to create income, you’ll always be running just to keep up.

Smart marketers, however, are willing to break even or take a loss to get a new customer. This is because they know that the real ROI comes from existing customers through loyalty, repeat business, and referrals. You’ll see what I mean in the next section when we talk about the Consumption stage of your ROI Strategy.
First, I want to challenge you to change your perspective on the math and psychology converting leads and prospects into customers. Starting with the math, the table below defines the Content Marketing KPIs relevant to the Conversion stage of your ROI Strategy, including the formula for each KPI and an example of the formula:
NOTE: The “Webinar #1” in the examples below is a fictitious name for sales style video published on your website.
Conversion Rate
Conversion Rate (CR)
The percentage of unique content viewers who become paying customers
Conversion Rate Example
*This number represents the total number of leads who first connected with your content by visiting your “Webinar #1” web page. In this example, 108 of the 1,200 people who first found your content through “Webinar #1” eventually became paying customers.
*You are reading the VQ Success article on How to Track Content Marketing ROI.
Conversion Cycle
Conversion Cycle (CC)
The average number of days between a prospect’s first content view and their first purchase (conversion)
Conversion Cycle Example
*This number represents the total number of converted leads who first connected with your content by visiting “Webinar #1.” In this example, 108 of prospects who first found your content through “Webinar #1” and eventually became paying customers.
**You are reading the VQ Success article on How to Track Content Marketing ROI.
Cost Per Conversion
Cost Per Conversion (CPC)
How much it costs you to convert a prospect into a customer
*The “item” can be a campaign, a distribution channel, or an individual piece of content.
Cost Per Conversion Example
*This number represents the total number of converted leads who first connected with your content by visiting “Webinar #1.” In this example, 108 of prospects who first found your content through “Webinar #1” and eventually became paying customers.
*You are reading the VQ Success article on How to Track Content Marketing ROI.
Conversion Value
Conversion Value (CV)
The average amount of income earned from a new customer conversion
Conversion Value Example
*This number represents the total number of leads who first connected with your content by visiting your “Webinar #1” web page. In this example, 108 of the 1,200 people who first found your content through “Webinar #1” eventually submitted their contact information and became leads.
**You are reading the VQ Success article on How to Track Content Marketing ROI.
ROI Stage #4 Forecast Formulas
(The examples below are based on the KPI examples in the table above)
Conversion Forecast*
*This forecast uses your 9% Conversion Rate to estimate how many conversions might result from 5,000 unique views of “Webinar #1.”
Conversion Income Forecast
ROI Stage #4 and Marketing Psychology
The forecasting formulas above suggest that 5,000 unique views of “Webinar #1” could yield (on average) 450 conversions and $269,550 in income. This means that even if you invest $250,000 a year to drive 10,000 new viewers to “Webinar #1” you would likely attract 900 new customers and earn about a half million dollars as a result.
This might not sound like much once you subtract the initial $250,000 investment and other overhead costs. However, in the next section of this article you’ll see that the real profits are in Stage #5 of your ROI Strategy. For now, let’s talk about how Buyer’s Journey psychology applies to this stage.
The first rule of Conversion is that you should only make conversion offers to prospects in Stage #3 or Stage #4 of the Buyer’s Journey. Buyer’s Journey Stage#1 Prospects, for example, might match your Buyer Persona and they will have the problem that your product or service solves.
However, they’re either unaware that they have the problem, or unaware of how relevant, critical, and urgent it is. This makes them indifferent to any messages about how to solve their problem and resistant to sales style content.

READ MORE: Buyer’s Journey vs Customer Journey article.
Your job is to turn them into a Buyer’s Journey Stage #2 Prospect, collect their contact information, and use email, SMS, or other follow up strategies to turn them into a Buyer’s Journey Stage #3 Prospect before trying to convert them. Likewise, Buyer’s Journey Stage#2 Prospects also match your Buyer Persona and they have the problem your product or service solves. They’re also aware of how relevant, critical, and urgent it is.
However, they’re looking for information on either how to solve their problem themselves or to get help solving the problem. They will also be resistant to sales style content. It’s a common mistake to assume that either type of prospect is ready to hear a sales message. They may not even be looking for your TYPE of product or service. If you try to convert them too early, you’ll look like another Rubber Chicken marketer, instead of a trustworthy expert.
Your conversion content should be strictly for Prospects in Stage #3 or Stage #4 of the Buyer’s Journey. The secret is to target and segment your visitors and leads according to their stage in the Buyer’s Journey, and make sure they get a message relevant to their Stage. For example, a Buyer’s Journey Stage #3 prospect is sold on the TYPE of product or service you sell and looking for the best brand.
Your conversion messages need to sell them on the Relevance, Superiority, and Uniqueness of Your Brand. Once you’ve this sale, only then should you treat them like a Buyer’s Journey Stage #4 Prospect. Otherwise, they’ll either price shop you against a competitor, or buy from the person with a message more fit to their state of awareness.
Finally, we have Buyer’s Journey Stage#4 Prospects. These are prospects who have compared you with competitors have decided to buy from you. They just haven’t placed an order yet. Your job is to answer their most common objections, tell them what will happen next, and give them a reason to respond right now.
Bottom line, you should only make conversion offers to prospects in Stage #3 or Stage #4 of the Buyer’s Journey. This means your conversion offers and messages should be customized for these prospects. Most importantly, you should have a strategy for directing Buyer’s Journey Stage#3 Prospects and Buyer’s Journey Stage#4 Prospects to different versions of your conversion message (landing page, webinar, etc.).
If this sounds impractical, I encourage you to read our Buyer’s Journey vs Customer Journey article for more information on this topic. The better you understand the Five Stages of the Buyer’s Journey, the easier it will be to segment your prospects, customize your messages, and leverage the ROI Forecasting Formulas in this article.
– Article Continues Below Stats –
Conversion Stats: Content Marketing = More Sales
– Article Continues Below Comic –
*You are reading the VQ Success article on How to Track Content Marketing ROI
ROI Strategy Stage #5: Consumption
GOAL: Sending your customers personalized messages and offers to increase satisfaction, loyalty and consumption, earn positive reviews and referrals, and to win back lost customers.
Examples of Consumption Content
*Non-cash incentives are 24% more effective at boosting performance than cash incentives (Source: University of Chicago).
How to Track Content Marketing ROI at Stage #5
This is where the money is. It’s also where most marketers invest the least time, money, and energy. They focus nearly all their efforts on the low-hanging fruit of “ready-to-buy” prospects and neglect the gold mine that’s sitting right under their nose.
That gold mine is what I call the Consumption stage of your ROI Strategy, and that’s the topic of this final section on How to Track Content Marketing ROI.
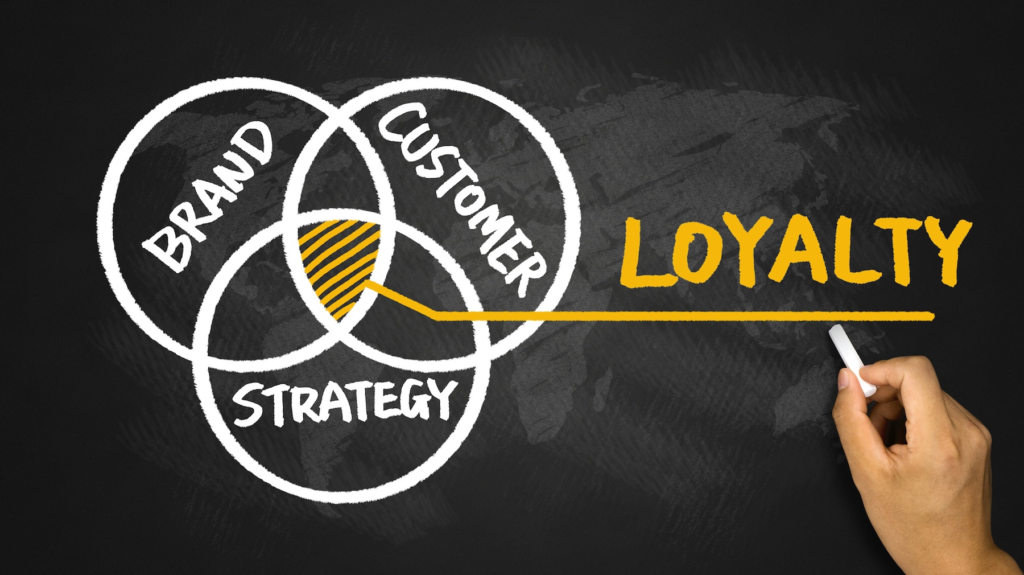
Once you grasp, apply, and perfect the math and psychology of this stage, you’ll create a marketing machine that rewards you with a steady flow of leads, customers, and profits. Starting with the math, the table below defines the Content Marketing KPIs relevant to the Consumption stage of your ROI Strategy, including the formula for each KPI and an example of the formula:
NOTE: The “Buyer Persona #3” in the examples below is a fictitious name for one of your customer segments.
Value Per Transaction
Value Per Transaction (VPT)
The average transaction value for customers in a certain segment over a given time period
Value Per Transaction Example
**You are reading the VQ Success article on How to Track Content Marketing ROI.
Value Per Customer
Value Per Customer (VPC)
The average income earned from a customer in a certain segment over a given time period
*This “given time period” can be a month, a year, or the full customer lifetime.
Value Per Customer Example
*You are reading the VQ Success article on How to Track Content Marketing ROI.
ROI Stage #5 Forecast Formulas
(The examples below are based on the Stage #3 Forecast Formulas and the KPI examples in the table above)
Lead Collection Forecast for Buyer Persona #3*
*This forecast uses your 2% Segment (Buyer Persona #3) Lead Collection Rate to estimate how many leads might result from 10,000 visits to “SEO Article #9.”
Conversion Forecast for Buyer Persona #3
Conversion Income Forecast for Buyer Persona #3
Yearly Income Forecast for Buyer Persona #3
ROI Stage #5 and Marketing Psychology
The Forecast Formulas above tell us that if we invest $100,000 a year to drive 100,000 new “Buyer Persona #3” visitors to “SEO Article #9,” we should attract 2,000 new “Buyer Persona #3” leads a year, 600 new customers, and approximately $360,000 in initial revenue. However, it also tells us that those 600 customers should bring us $600,000 a year.
Of course, some customers will drop off after a year or two, but others will keep buying. The better job we do at marketing to our existing customers, the more referral business they’ll bring us, and referrals always mean bigger payoffs at less cost. Again, I have personally seen several entrepreneurs become self-made millionaires using this mathematical approach to marketing.
Of course, your success with this formula will depend on how well you apply the second ingredient of scientific marketing, which is psychology. The psychology of ROI Strategy Stage #5 is based on Stage #5 of the Buyer’s Journey. Buyer’s Journey Stage #5 Prospects are no longer just prospects. They’re customers who we market to for the following reasons:
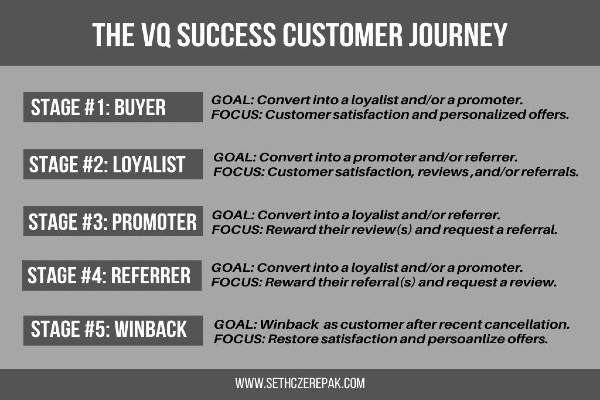
Stage #5 of the Buyer’s Journey is what we content marketers call the “Customer Journey.” The Customer Journey represents the stages of loyalty a customer progresses through as they become more involved in using and promoting your brand, product, or service.
READ MORE: Buyer’s Journey vs Customer Journey article.
Unlike the Buyer’s Journey and ROI Strategy Stages, the Customer Journey Stages don’t always follow a straight line. Since Customer Journey marketing is beyond the scope of this article, I’ll wrap up this section with a brief summary of the Customer Journey Stages:
Customer Journey Stage #1: Buyer
Customer Journey Stage #1: Buyer
Description: a brand new customer who has recently bought your product or service.
*You are reading the VQ Success article on How to Track Content Marketing ROI.
Customer Journey Stage #2: Loyalist
Customer Journey Stage #2: Loyalist
Description: a customer who buys and uses your product or service on a regular basis.
*You are reading the VQ Success article on How to Track Content Marketing ROI.
Customer Journey Stage #3: Promoter
Customer Journey Stage #3: Promoter
Description: a loyalist who has also written a positive review about your business.
*You are reading the VQ Success article on How to Track Content Marketing ROI.
Customer Journey Stage #4: Referrer
Customer Journey Stage #4: Referrer
Description: a loyalist who referred other paying customers to your business.
*You are reading the VQ Success article on How to Track Content Marketing ROI.
Customer Journey Stage #5: Winback
Customer Journey Stage #5: Winback
Description: a loyalist who has recently stopped using your product or service.
*You are reading the VQ Success article on How to Track Content Marketing ROI.
– Article Continues Below Stats –
Consumption Stats: Loyalty Drives ROI
– Article Continues Below Comic –
*You are reading the VQ Success article on How to Track Content Marketing ROI
Final Thoughts on How to Track Content Marketing ROI
We hope you enjoyed this article on How to Track Content Marketing ROI.
In conclusion, let me share one last, very important, tip on how to calculate the real cost of your content. You do this by adding up the total product cost (in money, time, and payroll cost) to create a single piece of content. This includes any costs associated with publishing and distributing it. I call this your Production Cost.
Production Cost KPIs don’t tell you how your content is performing. They do, however, help you discover how profitable a piece of individual content is.
For example, let’s say you want to know the ROI for an article on your website. The article took a total of 120 hours for your Content Marketing Team produce and distribute.
This includes all hours spent on researching, outlining, writing, editing, designing, and posting the article.

Let’s also assume that you pay your content marketing team members $25 an hour (on average). This makes your total product cost for this article $3,000 ($25 * 120 hours). If this article brings your company a total of 50 leads, your total CPL (cost per lead) for the article is $60 ($3,000 / 50). If 5 of these leads become customers, your total CPC (cost per conversion) is $600 ($3,000 / 5).
If your VPC (value per customer) for each of these customers is $700, your total income for the article is $3,500 ($700 * 5), and your total ROI for the article is $500 ($3,500 – $3,000). While $500 might sound like chump change, remember that this article can continue to attract leads as long as it’s showing up in the search engines, being shared on social media, or linked to other websites.
Over a span of three years, this article could bring a total of 200 leads. Now, your total CPL for the article becomes only $15. Assuming that you continue to improve your Conversion Strategy, let’s say that 30 of these 200 leads become customers. Now, your total CPC (cost per conversion) becomes only $100.
Moreover, if you continue to improve your Consumption Strategy, let’s say that your VPC (value per customer) for each of these customers is $900. Now your total income for your website article becomes $27,00 ($900 * 30), and your total ROI becomes $24,000 ($24,000 – $3,000).
This is an example of Content Equity, which we explain in our article on the Five Benefits of a Content Marketing Strategy. This is the clarity and confidence you can get from knowing How to Track Content Marketing ROI based on the real cost of your content. This mathematical approach to content marketing debunks the cliché that marketing is “not an exact science.”
By applying the strategies we’ve unpacked in this article, you can create an ROI Strategy that rewards your business with an evergreen stream of high-quality inbound leads. If you’re ready to make this happen, we need to talk. Just fill in the form at the bottom of this page, and tell us how we can help.
This concludes our article on How to Track Content Marketing ROI.
-Best
